Imagine there is a mock planet, where there is only two seasons: Warm and Cold. The planet is so absurd that there is NO interannual variability in the Cold season, but Very Large interannual variability in the Warm season. Now we know the planet experiences a long-term constant warming trend, and we use a thermometer with instrumental bias obeying normal distribution ~N(b,sigma) to measure 100-yr surf temp of the planet in Cold and Warm seasons, respectively.

In which season the measured warming trend is more trustworthy? In the Warm season, the estimated trend has a lower signal-to-noise ratio as both interannual variability and instrumental bias contributes to the uncertainty. While in the Cold season, the only uncertainty is the instrumental bias ~N(b, sigma). Thus we trust the Cold season-observed long-term trend.

Furthermore, what if we consider the improvement of the instrumental measurement? In that scenario, \|b\| and sigma tends to 0 as a function of time. Given a constant long-term warming trend, we could naturally use the recent measured trend to calibrate the estimated trend in the old days.

I know this thinking is quite idealized even naive, but it inspired me, instead of simply using the annual mean value, using an episode mean value in the seasonal cycle with the smallest power in interannual spectral band, to estimate the long-term trend, could give us a larger signal-to-noise ratio. The ENSO signal just exhibits the smallest variability in boreal spring.
This idea comes from composing the 20C work. The above simple model was built when revising the IJC manuscript and discussed with Francis. The simple model could be helpful to understand the simple & idealized theory.
While the idea might be too difficult to express in the paper, and both the reviewers from Science Bulletin and IJC asked me why the springtime is so special.
Science Bulletin (rejected) Reviewer Comment: Why are the results different from Vecchi et al. (2006, doi:10.1038/nature04744)? Is it because Vecchi used annual data, but the authors focused on spring? Vecchi focused more on seal level pressure and surface wind stress, which are direct measures of the overturning circulation. This paper, however, mainly focuses on precipitation and clouds, which do not show the same information. For example, precipitation would increase with warming due to increasing water vapor, regardless of the circulation strength. Increasing cloud cover would not directly suggest stronger circulation, as there is litter information about the cloud types (deep vs. shallow). In addition, what makes spring so special?
IJC Reviewer Comment: The study points out the recent intensification of convection over WEP which is seasonally dependent. What lead to this result or why this seasonal dependence, which is not very clear to me? It would be more informative to the readers if the authors quantitatively completely elaborate this point further by describing these aspects clearly from the previous studies (e.g, Lee et al 2016; take any previous study showing the climatological seasonal cycle of WEP convection).
Reply:
At least two factors contribute to the special role of boreal spring in seasonal cycle. First, during the last several decades, precipitation strengthens most significantly in boreal spring over the WEP-MC. The positive trend of springtime rainfall is above 2.5 [mm day−1 (35yr)−1], accounting for more than 40% of the 35-year climatological MAM mean rainfall of the WEP-MC. In contrast, other seasons only show slightly increasing trends (Li et al., 2016). This fact serves to motivate us to investigate the question in the whole 20th Century. The second reason, which was added in L123–127, is that during boreal spring there is smaller observational uncertainty in the long-term climatic measurement. The following will explain how this interesting mechanism works.
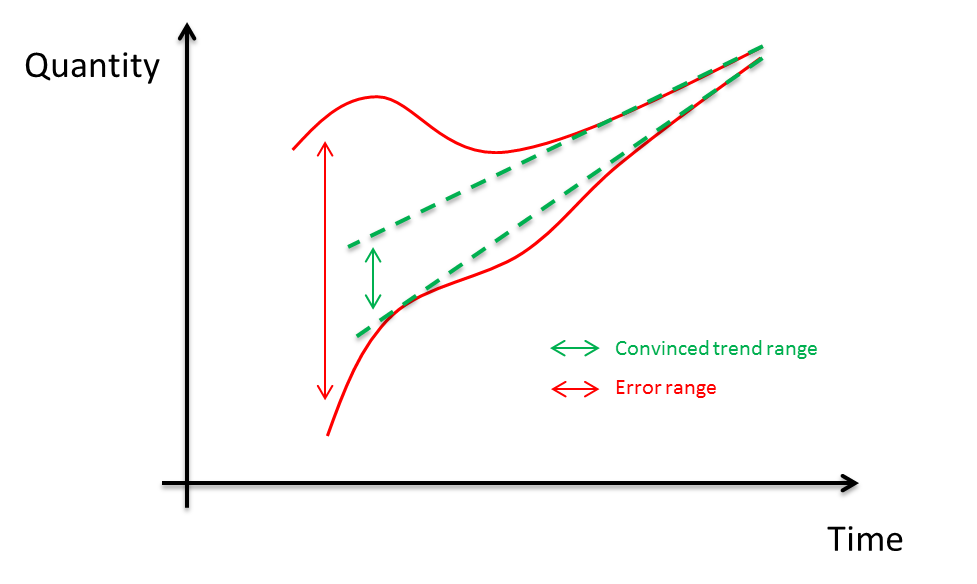
Using the data sets in spring is a natural way to filter the uncertainty caused by inter-annual variability. We assume that the bias (residual sum of squares) of long-term trend estimation of climatic elements originates from two parts: one is the uncertainty caused by natural variability, and the other is the instrumental bias. Specifically, imagining a virtual world with only nearly constant long-term trend but no periodical natural oscillation, as the instrumental bias decreases as a function of time due to the improvement of technology, we can use the recent trend to calibrate the previous larger-biased measurement. Fig. R1 is a sketch to interpret the technique: the band within the dashed green lines shows the convinced long-term trend range.

Figure R1. A sketch to interpret the reduction in linear trend uncertainty in a virtual world without periodical natural variability
Therefore, if we can lock an episode in the seasonal cycle with the minimum natural oscillated variability, we are more confident to believe the long-term trend derived from the data within this episode. Next we show the boreal spring is the special episode in this study.
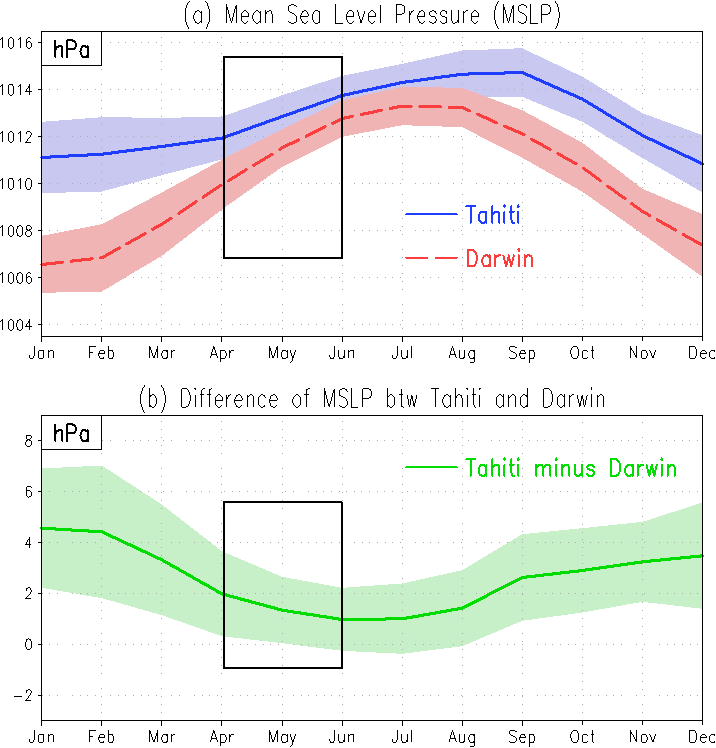
Fig. R2 displays the mean SLP and SLP differences between Tahiti and Darwin. As shown in the black boxes in Figs. R2a-b, springtime undertakes the lowest variation among the annual cycle. Using springtime mean values instead of simply annual mean values to calculate long-term trend, we can naturally filter the uncertainty contributed by natural oscillated variabilities. As the dominant inter-annual variability in the climate system is ENSO, the unique low variability feature of boreal spring comes from the seasonality of ENSO. Webster and Yang (1992) discussed the seasonality of the ENSO, and indicated that the spring is the ENSO developing or decaying season when the equatorial pressure gradient was the weakest.

Figure R2. Mean sea level pressure and difference of mean sea level pressure between Tahiti and Darwin (the shaded areas demonstrate the ranges within a ±1 standard deviation), after Yang et al. (2017).
Reference
Yang S, Deng K, and Duan W. The alternative interaction of the monsoon and ENSO: the effects of annual cycle and spring predictability barrier (in Chinese). Chinese Journal of Atmospheric Sciences, 2018. 42(3), 570-589
Updated 2020-06-20